Natural Gas (NG) is a fossil fuel formed by the remains of plants and animals, lodged under the ground for millions of years and exposed to extreme temperatures and pressure.
The cheap energy source can be found in the following areas onshore or offshore:
- Within the spaces of underground layers of rock formations,
- Within small spaces between formations of Shale and Sandstone (Think Fracking), or
- Along with deposits of Crude Oil.
Natural Gas wells can be categorised as follows:
- Associated: Wells that produce NG in addition to varying amounts of Crude Oil,
- Non-Associated: Wells that produce only NG,
- Condensate: Wells that produce NG liquids, in addition to NG.
Due to the lack of efficient techniques to transport Natural Gas, before WWII, it used to be a nuisance to Oil drillers, as they were expected to simply burn it off (flare it) or leave it in the ground. Now, it is one of the major movers of international politics and constituted 22% of the primary energy used to fuel the world in 2018.
It is rumoured that In 1971, Soviet Geologists came across a field in Turkmenistan that they thought had substantial Crude Oil reserves, only to realise that it was “just” Natural Gas. So they decided to flare it to burn off the toxic gas thinking that it will die out in a couple of weeks, instead of letting it escape into the atmosphere. Unfortunately, the Gates of Hell crater, so it has been dubbed, is still burning to this day.

Uses of Natural Gas
NG is used for power generation, process heating by heavy industries, and residential heating/cooking (i.e. heating and cooking). Moreover it is used as a feedstock to produce fertilizers and hydrogen.
Below is a chart showing the worldwide final consumption of Natural Gas by each sector.
Extracting NG one way or another and transporting it nearby for use has been around for thousands of years (first recorded in 500 BC in China). But aside from using it to light the USA and imperial England’s streets and warm houses and cook food (think the Bunsen Burner), NG only started to be utilised in the power and heavy industry sectors after WWII. Notably, it was first used to generate electricity in the 1940s in Switzerland.
Transport of Natural Gas
Pipelines
Yet, NG is not oil, you cannot simply put it in tankers and ship it, after you process it, to other areas and countries without extensive pipeline networks or the extensive development to liquefy it first. Pipelines are capital intensive and sometimes the receiving party is separated from the seller by oceans or political restrictions onshore, not to mention the environmental impacts that arise from the pipeline leakages that releases the gas into the atmosphere.
For example, the Arish-Ashkelon pipeline that supplied Israel with Egyptian NG had been attacked so many times in the past by militants in Sinai (5 times in 2011 alone).
Another example, in the early 1990s, after the dissolution of the Soviet Union, 90% of Russian NG made it to Europe via Ukraine. The former tried to diversify its routes via multiple mega pipeline projects. Now Russian NG has supplied 39% of Europe’s NG demand in the first half of 2020 through the pipelines shown below.
As you can see each country neighbouring Russia and Central Europe act as a customer and a transit point at the same time. Any dispute between Russia and one of the transit neighbouring countries could disrupt NG supplies to Europe.
This happened in 2009 when contractual disputes between Russia and Ukraine resulted in the former halting their NG supplies to the latter and southeastern Europe had an energy crisis during the freezing month of January for 13 days.
LNG
Then came LNG (Short for “Liquified Natural Gas”, the first patent was in 1915). The idea behind it is to decrease the temperature of the gas to negative 160 Degree Celsius to turn it into liquid and then transport it to clients around the world. After decades of perfecting a casualty-less methodology of liquifying Natural Gas came to effect, private companies in the USA shipped their first Liquified Natural Gas (LNG) to the UK in 1959.
LNG is a game-changer. A country with NG reserves can compete on the international markets and sell its products around the globe without relying on the political and environmental complications of cross-border pipelines.

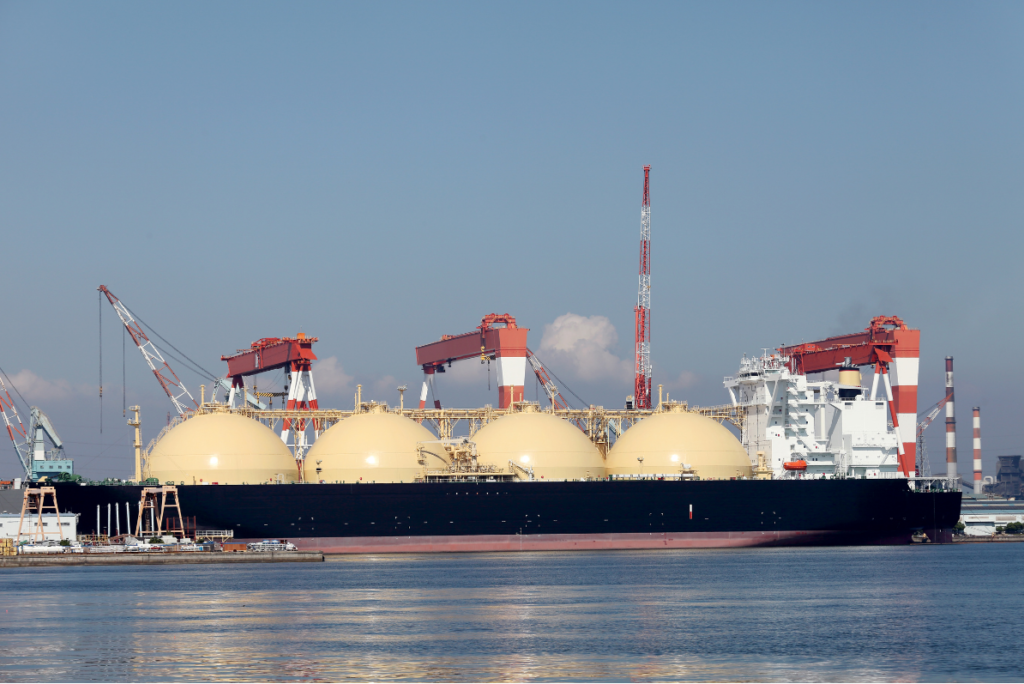
However, for a company/country to sell its Liquified NG, it needs to invest in building an LNG supply chain with trucks, storage, and utilise/develop a terminal on a nearby port to on load the juice to the marine tankers that will transport it, and the receiver should invest billions in building their own onshore or offshore terminals to be able to offload and store the juice they just bought from the sender.
As an example, Kuwait’s Al Zour LNG receiving terminal cost the local government approximately US$2.93 Billion to build so they would be able to import Natural Gas. Why so expensive you ask?
Look at the following diagram to see the number of facilities and functions required to successfully import NG and make it suitable for transfer via the transmission grid to the local recipients (Power Stations, Factories, etc.)
Typically, a receiving LNG Terminal would consist of the following Facilities:
- Tanker Offloading
- Regasification (Turning the liquid NG back to gas)
- Cryogenic Storage Tanks (at -160 Deg. C)
- Connections to the NG transmission grids.
Note that the storage tanks of Kuwait’s Al Zour Terminal are above the ground as shown below.
The Big NG Players
Note 1: NG is measured in Cubic Meters, Cubic Feet, or Metric Tonns, among other measurement standards. I prefer Cubic Meters, so I will be using it for reference here.
Unlike Oil, NG’s share of power generation and industrial heating has increased over the past decades (Shown below). This stems from the fact that NG produces less Green House Gases than Crude Oil when burnt, which has pushed many governments to add Natural Gas to their energy policy as a transition fuel, to reduce their CO2 emissions while they shift towards renewable energy.
Top Natural Gas Reserves
The country with the most Natural Gas Reserves is Russia with approximately 50,279 Bcm (Billion Cubic Meters), followed by Iran and Qatar at 33,988 Bcm and 23,831 Bcm, respectively.
The Top 10 own 80% of the world’s Natural Gas Reserves. However, each country’s role in the Natural Gas market is different and deserves a separate post, which I will talk about soon.
Top Natural Gas Consumers
The amount imported by each country is displayed in dark grey next to the coloured bars. It is interesting when you get to look at how much a country would import to satisfy its local demand. Germany’s data shows that in 2019 it imported more than the country consumed, however, OPEC’s NG export report shows that Germany exported around 28 bcm of NG in 2019, which explains the difference in the graph.
Top Natural Gas Exporters
Most of the countries mentioned in the graph already have substantial reserves of NG, except for the Netherland, which had approximately 111 Bcm of reserves, while the graph shows that it had exported 55 Bcm in 2019. This is due to the Netherlands being one of Europe’s leading energy trading hubs through its Title Trading Facility, or TTF, which acts as a “roundabout” where contracts for the gas can change hands virtually between buyers, ex: a Utility company, and vendors, after which the buyer can take delivery of the gas at any point in the network and the vendor can supply gas at any point in the network.
Top Natural Gas Importers
China is the world’s biggest NG importer and has the world’s 3rd largest demand for gas. China imported 43.4% of its demand in 2019 through conventional pipelines (38%) from Turkmenistan and Central Asia, and LNG shipments (62%) from Australia, Qatar, and Malaysia, among other countries.
Germany receives all of its NG via pipelines through Russia, Norway, and the Netherlands, while it is in the process of constructing its first LNG receiving port in Stade in the north of the country.
International Demand

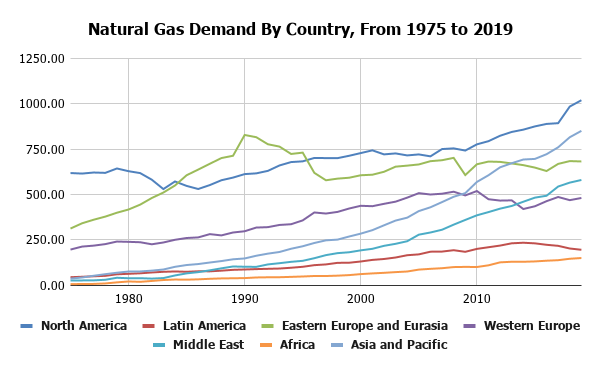
The data covers the demand per region between 1975 to 2019. North America leads the way, powered by the USA’s demand increasing by 35% over the period, while Canada’s demand tripled over the same period.
Furthermore, Asia and Pacific’s NG demand leapt over the past 44 years mostly due to the region’s massive industrialization, notably, Japan, South Korea, and China. Note that China’s demand increased by 30% alone in 3 years, between 2016 and 2019. This is mostly due to the country adding more NG to its electricity generation mix and phasing out coal-fired power generation.
The Middle East’s demand has also been on the rise over the same period, mostly lead by Iran and Saudi Arabia. This is due to the rapid industrialization of the region, investments in newer Gas-powered generation stations, and the increase in their water desalination capacity.
On the other hand, demand in Western and Eastern European countries has fluctuated over the same period. However, Western European Gas demand is expected to decline further over the coming two decades according to IEA, due to the increase of the penetration of the Renewable Energy sources in the Bloc’s Electricity mix and the adoption of Hydron as a source of energy as it advances towards a Net Zero emissions target by 2050.
Eastern European countries encountered a decline in demand after the dissolution of the Soviet Union in 1990 and have not recovered to the pre-1990 levels since then. However, the IEA forecasts that the Euroasian demand will increase by 0.5% per year between 2019 and 2025.
Natural Gas Prices Vs. Oil
Natural Gas prices are set using one of these three systems:
- Hub Pricing (Defined by supply and demand at a regional hub)
- Oil-index Pricing (increases or decreases depending on international oil prices)
- Government-regulated Pricing
Historically, NG and Oil products were viewed as replacements for each other when it came to power generation and industrial heating. Therefore, an increase in the price of one of the commodities would push the buyers to switch to the other and increase the demand, and the price, of the second commodity as a result.
Additionally, in the 1960s, European Countries and Japan had indexed the price of their long-term Natural Gas contracts (20 to 25 years in length) to Crude Oil’s price to encourage electricity producers to switch from using Oil to NG for environmental reasons. This as a result coupled the prices of both commodities in the European and Japanese markets.
This has changed for various reasons, including:
- Power companies and manufacturers started to decommission older generators that depended on oil products and invested in their fired counterparts.
- Hydraulic Fracturing has drastically increased NG supply on the USA market, thus driving the price lower in North America.
- As a result, Oil-Indexed contracts in Continental Europe became twice as expensive as their US Hub-priced counterparts by 2009, and 4 times in Asia by 2013.
This, however, has not changed majorly changed the dynamics of the Asian market. While Japan and Korea, for example, have been going through a long process of market liberalisation, the majority of the NG agreements in the region are Oil-indexed.

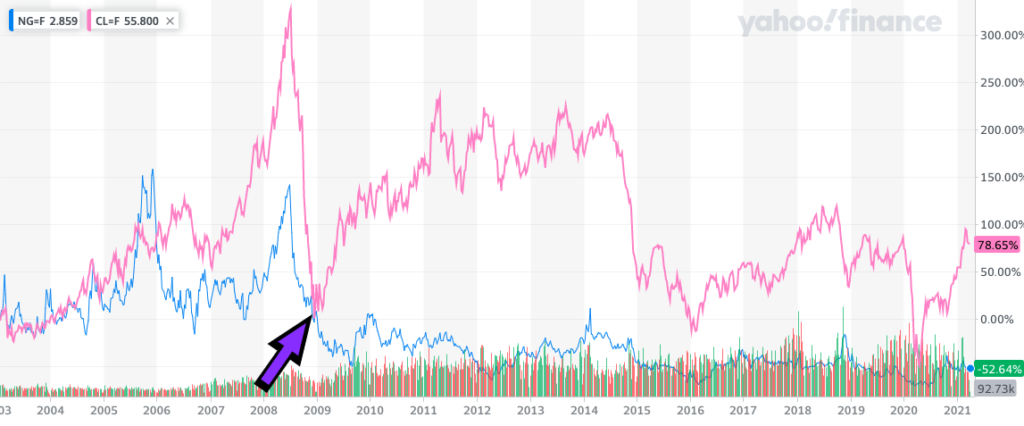
The decoupling of both pricings shows clearly right after the great recession in 2008. There were still a few instances when NG prices tracked Crude Oil’s, however, the drivers behind the prices of the commodities are different. Nowadays, more regions opt for Hub pricing, and while there is an abundant supply of NG from different countries around the world, the pricing in each regional hub is different from the other.
Green House Gases Emissions
As far as Fossil Fuels are concerned, Natural Gas is the least polluting source. NG produces at least 50% fewer emissions than Coal-fired power plants and 20% less than Gasoline-powered vehicles. Furthermore, NG emits less Nitrogen Oxide and Sulfer Dioxide than other fossil fuels.
However, the environmental impacts of Natural Gas stem from the processes of drilling and extracting it, in addition to, transporting the commodity via pipelines or other means of transport.
See below a table comparing the emissions of NG versus other fossil fuels.
| Fuel Type | Emissions – Kilograms of CO2/ Million Btu |
| Natural gas | 53.07 |
| Propane139.0 | 63.05 |
| Gasoline (without ethanol) 157.2 | 71.3 |
| Diesel fuel and heating oil161.3 | 73.17 |
| Coal (sub-bituminous)214.3 | 97.20 |
| Coal (lignite) 215.4 | 97.70 |
| Coal (bituminous) 205.7 | 93.30 |
| Coal (anthracite) 228.6 | 103.70 |